




A Sunbelt operator ran a first-month-free promo across 10 facilities, Sep–Dec 2024. We used Claude and Cubby's data warehouse to find out whether it actually paid off.
The promo worked on volume: 41 incremental rentals, total move-ins 22% above the same period in 2023, on a non-FMF baseline that held roughly flat.
FMF tenants didn't stay as long — median length of stay ran about 15% shorter across every channel, both years.
They also came in through different doors. FMF skewed toward phone and walk-in; non-promo rentals skewed online.
Net of $200 acquisition cost per rental, the added volume more than covered the shorter tenancies: $21,600 in net revenue versus $16,600 without the promo. About $5,000 better, or 30%.
You ran a move-in promotion online last year, a “first-month-free” to boost occupancy in the off season.
It worked in the short term; you had a spike in rentals. But now you ask: did those tenants stick around? Did I make up my cost of acquisition?
Was the promo worth it?
It's an urgent question to answer as this year’s summer boom slows and occupancy starts to dip again. But finding an answer can be tricky without the proper data and means to analyze it.
Answering it means distilling rental records, move-out history, original lead source data across several months, and ECRI histories, all across multiple facilities. You need an all-in Customer-Lifetime-Value for these promo customers to compare with your non-promo customers.
This is the kind of problem Cubby’s data warehouse was built to answer.
Below, we’ll show how we arrived at an answer with just a few, simple Claude prompts.
Putting Together a Dataset
First, we’ll need to clarify what data we’re going to use. With the data warehouse connected to Claude, we can simply ask for the data we’re looking for, rather than dealing with exporting files or dealing with tech
Prompt: Gather data from all my rentals for the last two years. I need to know the start date and end date, the channel they came in through, whether they had a first-month-free promo or not, and the facility where they rented.
Rental ID | Start Date | End Date | Channel | FMF? | Facility |
R-10041 | 2023-09-04 | Online | No | Sunbelt - North | |
R-10042 | 2023-09-05 | 2024-02-18 | Call | No | Sunbelt - Eastside |
R-10043 | 2023-09-06 | 2024-05-01 | Online | No | Sunbelt - South |
R-10044 | 2023-09-07 | Walk-In | No | Sunbelt - Lakewood | |
R-10045 | 2023-09-09 | 2023-12-14 | Online | No | Sunbelt - North |
R-10046 | 2023-09-10 | 2024-03-22 | Call | No | Sunbelt - Downtown |
R-10047 | 2023-09-11 | Online | No | Sunbelt - Meridian | |
R-10048 | 2023-09-12 | 2024-01-08 | Walk-In | No | Sunbelt - Ridgeline |
R-10049 | 2023-09-14 | 2024-06-30 | Online | No | Sunbelt - Eastside |
R-10050 | 2023-09-15 | Call | No | Sunbelt - Hillcrest | |
⋮ | |||||
2,210 total rentals — Jul 2023 through Dec 2025 |
Sample of 10 rental records — 2,210 total rentals across 10 facilities, Jul 2023–Dec 2025
Excellent! Claude has pulled exactly what we asked for—but come to think of it, we should also know the unit type and exclude typologies that skew the data.
Prompt: Can you include the unit type also? Let’s also exclude parking spots for now and focus on storage units.
Rental ID | Start | End | Channel | FMF? | Unit Type | Facility |
R-10041 | 2023-09-04 | Online | No | Standard 5×10 | Sunbelt - North | |
R-10042 | 2023-09-05 | 2024-02-18 | Call | No | Climate 10×10 | Sunbelt - Eastside |
R-10043 | 2023-09-06 | 2024-05-01 | Online | No | Standard 10×15 | Sunbelt - South |
R-10044 | 2023-09-07 | Walk-In | No | Climate 5×10 | Sunbelt - Lakewood | |
R-10045 | 2023-09-09 | 2023-12-14 | Online | No | Standard 10×20 | Sunbelt - North |
R-10046 | 2023-09-10 | 2024-03-22 | Call | No | Standard 5×5 | Sunbelt - Downtown |
R-10047 | 2023-09-11 | Online | No | Climate 10×15 | Sunbelt - Meridian | |
R-10048 | 2023-09-12 | 2024-01-08 | Walk-In | No | Standard 10×10 | Sunbelt - Ridgeline |
R-10049 | 2023-09-14 | 2024-06-30 | Online | No | Standard 5×10 | Sunbelt - Eastside |
R-10050 | 2023-09-15 | Call | No | Climate 10×10 | Sunbelt - Hillcrest | |
⋮ | ||||||
2,210 total rentals — Jul 2023 through Dec 2025 |
Same view with unit type column added — parking spaces excluded
A table with nearly 2,000 rows doesn’t help us much, let’s ask for a summary.
Prompt: Can you summarize this for me? How many rentals by month and year? How many had FMF? How many for each facility? For each rental channel?
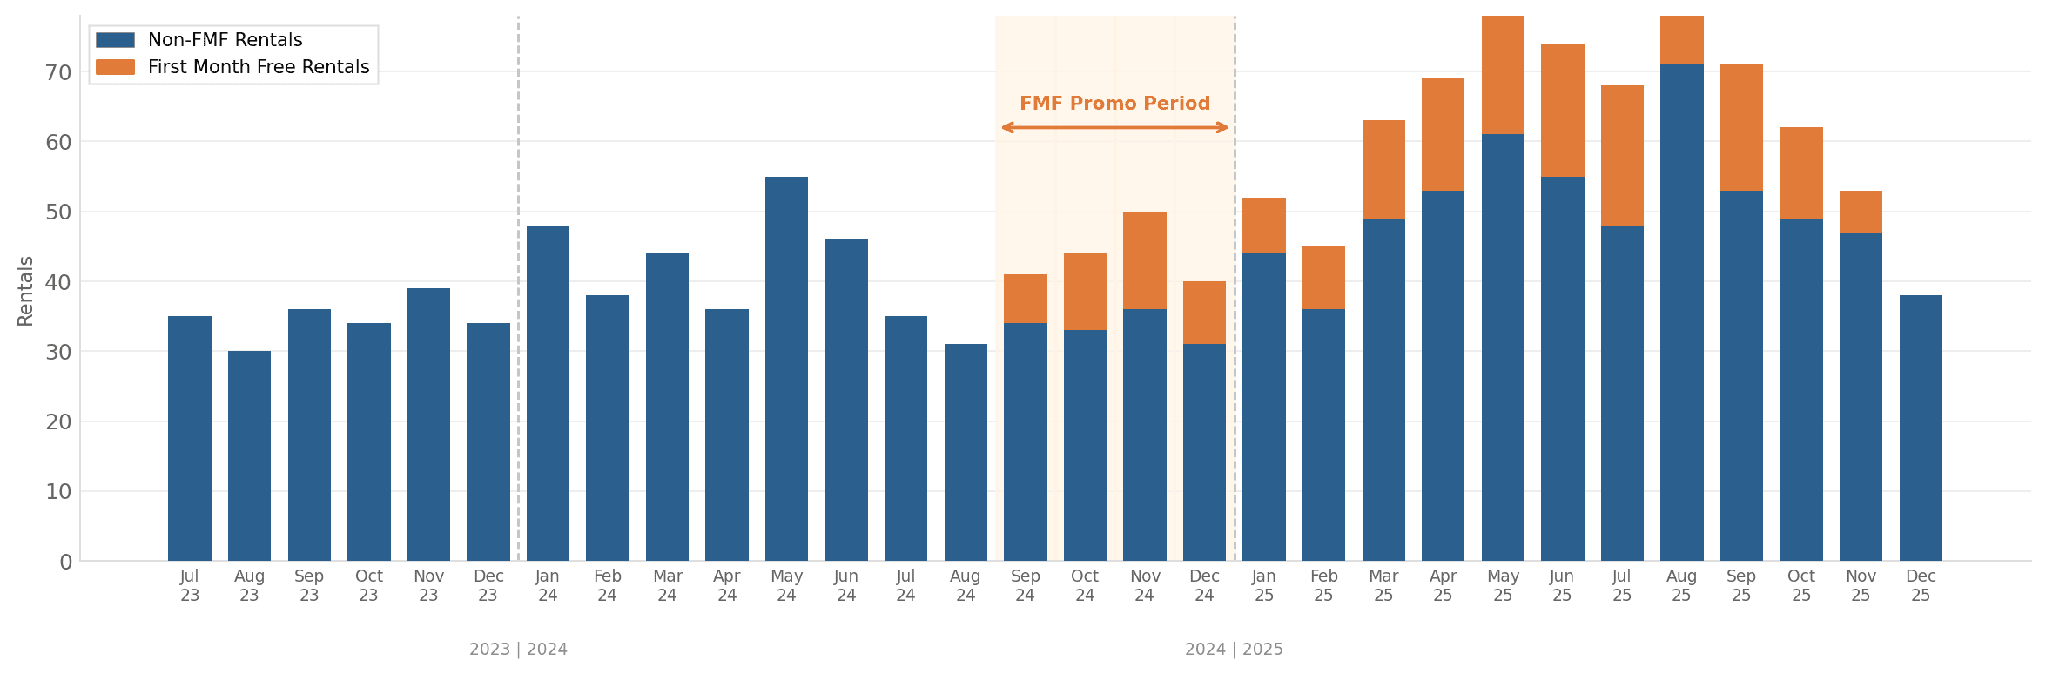
Monthly rental volume Jul 2023–Dec 2025 — FMF rentals (orange) stacked on non-FMF (blue); shaded band = promo period
Facility | Online | Phone / Call | Walk-In | Total |
North | 117 | 89 | 41 | 247 |
South | 108 | 84 | 35 | 227 |
Eastside | 92 | 71 | 28 | 191 |
Downtown | 88 | 67 | 24 | 179 |
Lakewood | 79 | 61 | 22 | 162 |
Ridgeline | 73 | 58 | 19 | 150 |
Westpark | 68 | 52 | 17 | 137 |
Meridian | 62 | 48 | 16 | 126 |
Commerce | 57 | 44 | 14 | 115 |
Hillcrest | 51 | 40 | 12 | 103 |
TOTAL | 795 | 614 | 228 | 1637 |
Table: Rentals by facility and rental channel — all 10 locations across the two-year period
Some interesting trends in online rentals. Let’s look closer…
Prompt: I’m surprised by the trend in online rentals. Can you break those out by marketing channel?
Marketing Channel | Online Rentals | Share of Online |
Organic Search | 291 | 36.6% |
Direct / Unknown | 248 | 31.2% |
Paid Search (CPC) | 168 | 21.1% |
Social / Referral | 55 | 6.9% |
Email Campaign | 33 | 4.2% |
TOTAL | 795 | 100% |
Online rentals by marketing channel — organic search and direct account for over two-thirds of online volume
Looks like a clean dataset! Let’s start analyzing the impact of our first-month-free promo.
Assessing Impact
Once we have a dataset ready, we can move on to analysis.
Prompt: Okay, let’s see if offering the promo did anything. Can we see if the promo caused a bump in volume vs the previous year or other facilities?
Month | 2023 Total | 2024 Non-FMF | 2024 FMF | 2024 Total | YoY Change |
Jul | 35 | 35 | — | 35 | +0% |
Aug | 30 | 31 | — | 31 | +3% |
Sep | 36 | 34 | 7 | 41 | +14% |
Oct | 34 | 33 | 11 | 44 | +29% |
Nov | 39 | 36 | 14 | 50 | +28% |
Dec | 34 | 31 | 9 | 40 | +18% |
H2 Total | 208 | 200 | 41 | 241 | +16% |
H2 2023 vs. H2 2024 by month — non-FMF baseline held flat while FMF added incremental volume
In the promo months (Sep–Dec 2024), total rentals were 22% higher than the same period in 2023, driven almost entirely by the 41 first-month-free rentals added on top of a relatively flat non-FMF baseline.
This confirms what we already noticed unscientifically: the promo boosted rentals.
Let’s go deeper.
Prompt: Can you break these out by channel? I want to see if the FMF customers come from a certain channel.
Rental Channel | FMF Customers | Non-FMF Customers |
Online | 40% (17 rentals) | 51% (125 rentals) |
Phone / Call Center | 44% (19 rentals) | 37% (92 rentals) |
Walk-In / Manager | 16% (7 rentals) | 12% (30 rentals) |
TOTAL | 43 rentals | 247 rentals |
Channel mix during the promo period (Sep–Dec 2024) — FMF customers skewed toward phone and walk-in
Let’s dig into the aspects we don’t know intuitively – Length of Stay and overall profitability.
Prompt: I want to know if the FMF customers stayed as long as other customers. Can you show me the average length of stay for each group? Maybe break it out by channel because I know LOS varies a lot by channel.
Wait! You can’t do average LOS because a lot of these customers are still renting today. There’s a long tail on occupancy. Can you do median length of stay for each group?
Median LOS — FMF | Median LOS — Non-FMF | |
2024 Rentals | ||
Online | 95 days | 112 days |
Phone / Call | 80 days | 94 days |
Walk-In | 71 days | 83 days |
2025 Rentals | ||
Online | 100 days | 118 days |
Phone / Call | 84 days | 99 days |
Walk-In | 74 days | 87 days |
Median length of stay (days) — FMF customers consistently ~15% shorter across all channels and both years
So the FMF boosted rentals by 20%, but these extra rentals had a shorter LoS. We need to understand the tradeoff.
Prompt: The FMF group had a shorter length of stay, but the promo did bring in more of them. How can I say if the impact was net positive? Do I need to bring in my Cost of Acquisition here?
We’ll let Claude breakdown this next step on its own:
Good question. To answer whether the promo was net positive, I'd suggest a counterfactual comparison: estimate the revenue you would have earned without the promo, and compare it to what you actually earned with it.
Here's the approach:
1. Counterfactual baseline. Use your non-FMF rental volume and LOS from the same period — Sep–Dec 2024. This represents roughly what your business would have looked like without the promotion.
2. Actual scenario. Use the real FMF and non-FMF counts with their actual LOS figures.
3. Normalize for rate. Since unit sizes affect revenue, I'd apply a flat $100/month rate to both groups. This isolates the promo's effect rather than mixing it with unit-mix differences.
4. Include Cost of Acquisition. Yes — each rental cost you something to acquire, promo or not. Factoring in CoA (say $100 per rental) will tell you whether the incremental volume offset the shorter tenure.
Confirm those numbers and I'll run the comparison.
Prompt: Yes, let's run with that. Assume $100/month and $200 CoA. Show me the Sep–Dec 2024 actuals vs. the counterfactual — what would that period have looked like without the promo?
Here's the side-by-side:
Scenario | Rentals | Median LOS | Gross Revenue | CoA Cost | Net Revenue |
Without promo | 134 | 97 days | $43,400 | $26,800 | $16,600 |
With promo (actual) | 175 | 91 days* | $56,600 | $35,000 | $21,600 |
Difference | +41 | −6 days | +$13,200 | +$8,200 | +$5,000 |
* Blended average: FMF customers averaged 82 days, non-FMF averaged 97 days.
Here we can see the promo generated an estimated $21,600 in net revenue over Sep–Dec 2024, compared to $16,600 without it — about $5,000 more, or 30% higher.
The FMF group did stay about 15% less time on average, but the volume they added, on top of a non-FMF baseline that held roughly flat, more than offset the shorter tenancies:
The First-Month-Free promo was worth it.
The Takeaway
The data in this example may not match your specific situation and customer base; the answer to your question may be different than the answer above. And three years from now, the answer might be different than it is today.
More important than the specific answer we presented above are the tools we used to get there.
Cubby is built as an integrated platform. Its a system that connects your facility operations, your call center activity, your revenue management, and your marketing data under one roof. Cubby's data warehouse brings together:
Facility and lease data: Occupancy, move-ins, move-outs, unit mix, tenure
Payment and billing history: Revenue trends, autopay rates, delinquency patterns
Call center data: Inbound call volume, call-to-rental conversion, source attribution
Revenue management history: Rate changes over time, how pricing decisions played out
Marketing and lead source data: GA integration, where your rentals are actually coming from
With all of this data coming from one system, curated in a well-documented, annotated data warehouse, an LLM can quickly and accurately analyze the relevant points and get you answers to your most pressing questions. Questions like:
Which lead sources produce the highest-value tenants?
How do my facilities compare on revenue per occupied unit over time?
Which of my agents/managers is fastest at closing a deal? Does speed come at the cost of conversion rate?
How did my last rate change affect LTV?
The answer to the question today was “Yes, the promo paid off.”
But that's not the crucial point. What this exercise demonstrates is that the question was answerable at all, in minutes, without a data analyst or a spreadsheet marathon. The uncertainty that used to follow a promo, the vague sense that it "seemed to work", can now be replaced with a number.
That's the real value of a connected data warehouse. Not just that the data exists, but that you can actually use it: ask it real questions in plain language and get answers you can act on. Whether you're evaluating a promo, benchmarking a new facility, or trying to understand why one location outperforms another, Cubby gives you the infrastructure to stop guessing and start knowing.
Want to get started? Reach out to our solutions team and we'll get you set up.
Latest

Product Update
What 413,000 Collections Calls Reveal About Delinquent Tenants
Cubby Team
・
Read More

Company News
How Cubby Keeps Your Facility's Data Safe (and What a SOC 2 Audit Actually Means)
Cubby Team
・
Read More

Industry Insights
Switching Self Storage Software: Timeline and Real Costs
Cubby Team
・
Read More